Hospital Dashboard
تفاصيل العمل
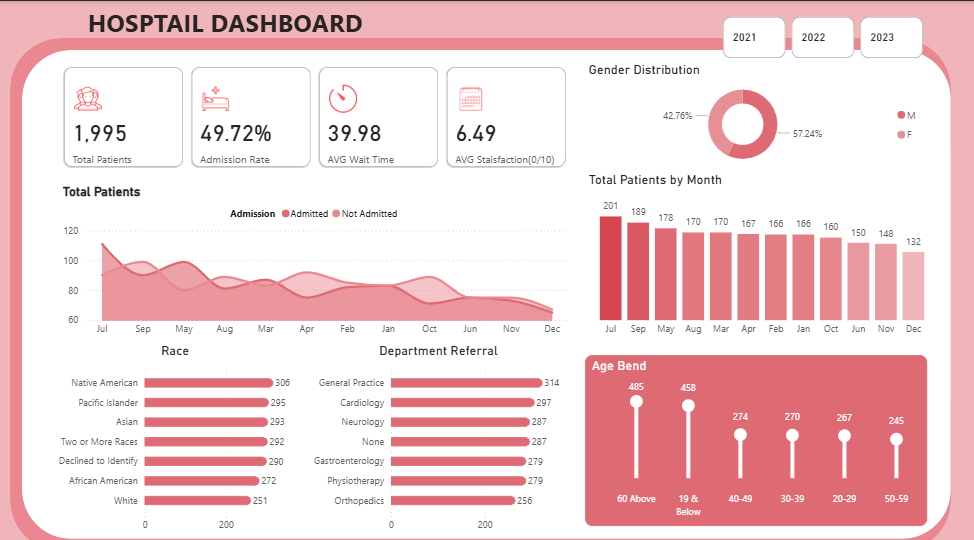
Hospital Dashboard Project Description This is a comprehensive healthcare analytics dashboard that visualizes key hospital performance metrics and patient demographics for the year ********** Key Performance Indicators (KPIs) The dashboard displays four critical metrics at the top: Total Patients: 1,995 patients treated Admission Rate: 49.72% of patients were admitted Average Wait Time: 39.98 minutes Average Satisfaction Score: 6.49 out of 10 Data Visualizations Gender Distribution A donut chart shows the patient gender breakdown with a relatively balanced distribution (approximately 57% male and 43% female). Total Patients by Month A bar chart tracks monthly patient volume throughout the year, showing fluctuations with the highest volumes in July (201 patients) and September (189 patients), and lowest in December (132 patients). Admission Trends A line graph displays admission patterns over 12 months, distinguishing between admitted and non-admitted patients, revealing seasonal variations in admission rates. Race Demographics A horizontal bar chart breaks down patient population by ethnicity, with Native American (306), Pacific Islander (295), and Asian (293) representing the largest groups. Department Referrals Shows the distribution of patients across different medical specialties, with General Practice (314), Gastroenterology (279), and Physiotherapy (279) handling the most referrals. Age Band Distribution A lollipop chart visualizes patient age groups, with the highest concentration in the 60+ age bracket (485 patients) and 19 & Below (458 patients). This dashboard serves as a vital tool for hospital administrators to monitor operational efficiency, patient demographics, and resource allocation needs.
المهارات المستخدمة
تعليقات
لم يتم ترك أي تعليق حتى الأن
تعجبك !، قم بمشاركها